Creation Steps
To create a report package, navigate to the home screen and select the “Report Packages” icon. From the “Report Packages” screen, click the “Create” icon (+) to create your Reporting Package.
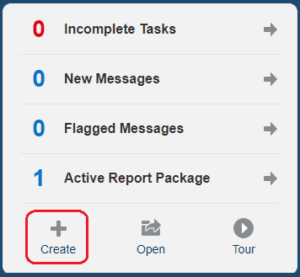
Note: A user can also create a Reporting Package by selecting “+ Create” on the home screen as shown in the image below.
After you create the “Report Package”, it will prompt you to complete the “Name” and “Description” fields. In the “Report Type” drop-down, select whether the report will be a Microsoft Word or PowerPoint document. Next, click the “Choose File” icon to upload a “Style Sample” document.
Note: When working with Microsoft Word report types in EPRCS, “Style Sample” documents must have a “.docx” file extension to be uploaded.
The “Style Sample” document determines the overall format of the Reporting Package, such as orientation, margins, size, page header and footer, etc. However, these settings can be overridden for individual sections or doclets within the Reporting Package.
Lastly, click “Browse” next to the “Save To” text box to specify where the Reporting Package will be saved in EPRCS.
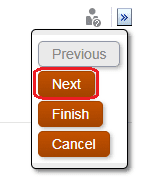
Once complete, click the “Actions” menu in the top right-hand corner of the screen and select “Next.”
Setting the Reporting Package Phases
Next, the user will determine which phases are applicable to the Reporting Package, as well as defining the timeline for each phase. Reporting Packages are outlined in 3 Phases, “Author”, “Review”, and “Sign Off”.
Note: All three phases are not required when creating a Reporting Package.
Enable the “Author Phase” by selecting the respective check mark. In the “Author” phase, an administrator can grant access or limit a user’s ability to interact within the Reporting Package. An administrator can control which users have access to specific sections or documents within the Reporting Package. Once this is enabled, click on the “Calendar” icons to define the following dates: “Start Author Phase On”, “Submit Doclets By”, and “End Author Phase On”. In addition, a user can add additional levels of approval before the “Review Phase”, by selecting the “+ Include Doclet Approval” icon, and then can modify the doclet approval timeline.
Enable the “Review Phase” by selecting the respective check mark. In the “Review” phase an administrator assigns a user the ability to review specific documents within a constructed timeline. The Review phase allows the Reviewers to provide commentary, which alerts the Authors of any questions, changes, or feedback a Reviewer might have. The Review phase is comprised of two key components, “Review Cycles” & “Review Instances”. Once the “Review Phase” has been enabled, click on the “Calendar” icons to define the following dates: “Start Review On”, “End Review Cycle 1 On”, and “End Review On”. In addition, a user can modify the review cycle timeline by creating additional review cycles before the “Sign Off Phase” by selecting the “+ Add Another Review Cycle” icon.
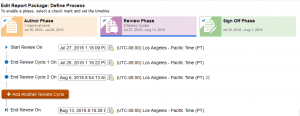
Note: There is no limit to the number of review cycles you can define in the Reporting Package.
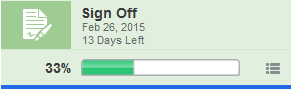
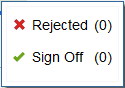
Enable the “Sign Off Phase” by selecting the respective check mark. The Sign Off phase enables an administrator to “lock-down” the Reporting Package content and attain a finalized sign off. In the Sign Off phase, the administrator locks the overall Reporting Package to prevent further changes. The Reporting Package “Signers” review the final report and either “Sign Off” or “Reject” the report’s content. If the report is rejected, the report package owner can unlock and correct the report content. If the report is signed off the process is complete, and the report is ready for publication. Moreover, Reporting Package owners can view a summary of the sign off phase. The summary can include completion percentage, number of sign offs, rejections, due dates, days remaining, as well as which users have signed off and any sign off notes. Once the “Sign Off Phase” has been enabled, click on the “Calendar” icons to define the following dates: “Start Sign Off On” and “End Sign Off On”.
After all phases have been defined, click the “Actions menu” in the top right-hand corner of the screen and select “Next.” After clicking “next”, the user will be prompted to assign users and groups to the Reporting Package. On the “Assign Users” page, the user can assign users and groups to the following Reporting Package responsibilities: “Owners, Reviewers, Signers, and Viewers.”
Note: As the creator of the Reporting Package, you are automatically assigned “Owner” responsibility.
- Owners can make changes to the report package structures and properties, execute development phase processes, and assign user responsibilities.
- Reviewers can review report package contents, and provide feedback as needed. Signers have final sign-off responsibilities for the report package as a whole. Viewers can only view report package content and cannot make changes to it.
Click the “Add User” icon to assign user roles.
Note: If the “Sign Off Phase” is enabled for the Reporting Package, the user is required to assign “Signer” responsibilities. All other responsibilities can be assigned and managed after the Reporting Package has been created.
Once complete, click the “Actions” menu in the top right-hand corner of the screen and select “Finish.” Now that the Reporting Package has been created, the users that have been assigned to the Reporting Package can start uploading and managing their content within the Reporting Package.
Organization and Progress
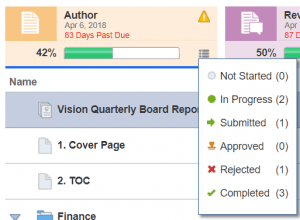
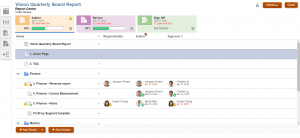
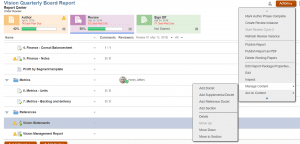
The report in this example is the “Vision Quarterly Board Report”. It is comprised of multiple documents: Cover Page, Table of Contents, multiple financial documents, and other metrics. A convenient functionality of Reporting Packages is that it prioritizes each document. Meaning when a document is uploaded to that Report Package, a user can organize it as needed, so when you open the overall report it is in the order in which you prioritized the documents. If we click the drop down arrow next to the Vision Quarterly Board Report and select “Preview” you will notice that the overall report is in the exact order in which the sub-doclets are organized: Cover Page->Table of Contents->Finance – Revenue Report (See image below). Moreover, in the example you will notice multiple functions of Reporting Packages. At the top you will notice a progress bar of the 3 reporting phases. If you click on the icon next to each one, it will show the user(s) assigned to that phase and their responsibility.
Due Dates
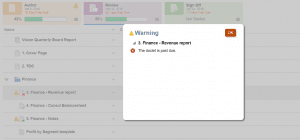
In addition, underneath shows the due date assigned to each phase. If a phase or task is “Past Due”, or action is needed on a document a user will see the warning symbol next to the document. If a user clicks on the warning symbol a pop-up will occur and explain the action that needs to be taken on said document, as referenced in the image below.
Managing Content and Doclets
Another feature within the Reporting Package, is that an administrator can add a section (folder) or supplemental doclets. To do, so an administrator will click on the Reporting Package and then click on the “Actions” menu located at the top right. Scroll down to “Manage Content”, and choose the option as needed.
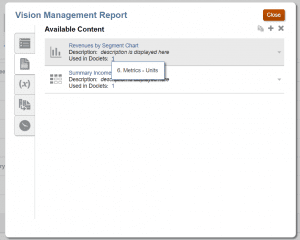
Under “Manage Content” you will notice multiple “Doclets”. All Doclets are similar, except for “Reference Doclets”. Reference Doclets are documents that a user creates by pulling data using the dimensionality from another EPM Cloud application or the custom built application within EPRCS. This allows a user to pull data from those data sources allowing the user to create Grids, Graphs, Text or an Image. Creating a Reference Doclet in Reporting Packages, allows the user to pull that data into the report through the “Embedded Content” feature. This feature provides the ability for the other doclets that make up the overall report to grab data (Grids or Graphs) from that Reference Doclet and add it to the report through the “Embedded Content” feature. In the example above, if you click the drop down arrow next to Vision Management Report, and then click “Inspect”, an admin/user can see the data that is in that report. If a user clicks the second tab on the left (See below image), you will now see what data from the Vision Management Report is being pulled into the overall report. In this example it is the “Revenue by Segment Chat” and the “Summary Income Statement”. In addition, if the user clicks the number next to “Used in Doclets” it will show which exact doclet references that data.
Wrap Up
In conclusion, EPRCS has many features that reduce any bottlenecks in the reporting cycle. It truly is a manager’s dream reporting application. EPRCS provides complete control of the reporting process every step of the way, and allows key reporting managers to have organized oversight into each report. Not only is the application dynamic in nature with all it’s built in capabilities, but also having the ability to edit reports and data through Smart View in excel, makes EPRCS the one-stop shop for reporting.
Now What?
- Part 1: Revamping Enterprise Reporting – Overview of Oracle’s EPRCS
- Part 2: Navigating the Key Reporting Elements of the Oracle EPRCS User Interface