Authored by Nick Scott | Director, Data Analytics
As a financial leader, having access to real-time financial data is essential for making informed decisions. But with data and reports tied up in different platforms, it can be challenging—and time-consuming—to piece together a holistic view of your organization’s financial health. Whether you’re struggling with data silos or looking to enhance decision-making, OneStream and Power BI (PBI) is an unbeatable combination for the modern finance team.
As OneStream Platinum Partners, our team of implementation experts use this integration to deliver next-level reporting and customizable dashboards. We’re sharing six key reasons why connecting OneStream and PBI is essential to driving more confident business decisions and maximizing your OneStream investment.
Want a customized look at how this integration can transform your financial reporting capabilities?
Intrigued but need more information? Keep reading to learn why this integration is so vital to optimizing your accounting, finance, and operational functions.
Six Reasons to Connect OneStream and Power BI
#1: Centralize data and reporting to unlock deeper financial insights
With this powerful combination, you can unify financial application data, operational data sets, and other enterprise-wide data sources into a single, centralized platform. The integration provides a complete view of your organization’s performance without the tedious process of merging disconnected reporting systems and disorganized data. This empowers your team to generate accurate insights at lightning speed and make confident, data-driven decisions.
#2: Save time and increase data accuracy with automated processes and real-time analysis
While OneStream provides a single source of truth for financial data, Power BI visualizes the data in an accessible, understandable format. By integrating these two platforms, the process of data extraction to generate custom reports and dashboards is completely automated. This eliminates the need for manual intervention in a report or PowerPoint deck, eradicates data silos, reduces errors or inconsistencies, and decreases the time it takes to create reports and dashboards. In turn, you get to spend more time analyzing data than processing it.
#3: Drill through capabilities for extensible dimensionality
A superpower of the connector is its ability to seamlessly integrate extended dimensions/hierarchies into a single comprehensive Power BI report. This eliminates the need for separate cube views or queries across your extended dimensions to create a fully consolidated report. This allows users to replicate the functionality seen within OneStream but with less effort to compile and analyze the results.
Another powerful benefit is the ability to utilize your custom user-defined dimensions from inside OneStream. So, if you have different reporting hierarchies or need to account for eliminations, this system will seamlessly integrate those custom definitions.
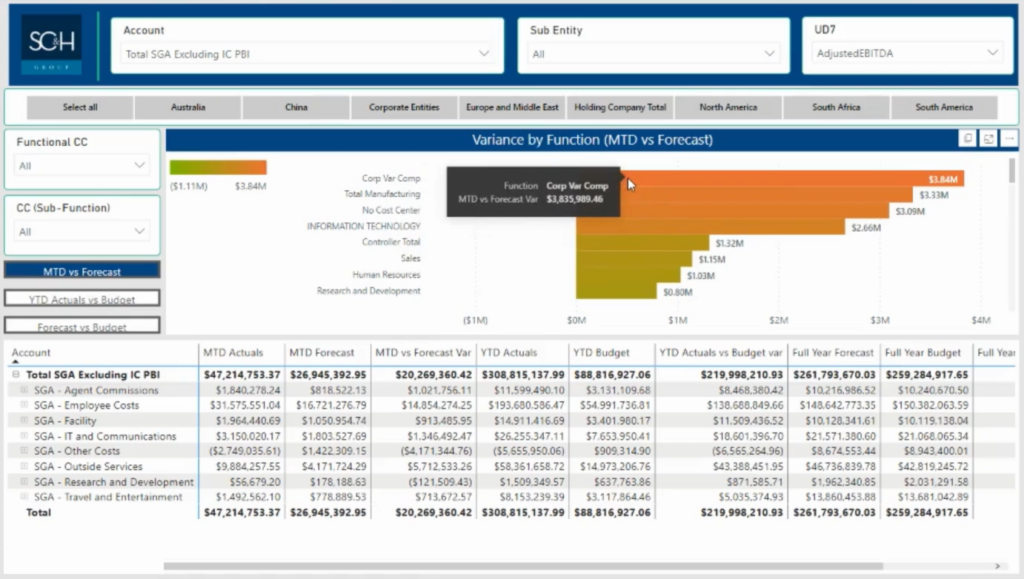
#4: Enhance data visualization with greater flexibility and customization
Power BI enables better insights through highly customizable dashboards and visualizations such as heat maps and matrix tables. While OneStream offers a comprehensive financial consolidation platform, PBI’s enhanced dashboards help uncover trends faster and make it easier to communicate information to executive leadership. Accelerate time-to-value even further with a starter pack of best-practice Power BI dashboards.
#5: Foster collaboration and information accessibility across teams and platforms
By providing a single source of truth and easy-to-understand visualizations, teams can more readily analyze data and share quick insights cross-functionally. The integration also grants non-OneStream users access to OneStream data and reporting to foster collaboration and eliminate data silos. With customized, self-service dashboards tailored to OneStream dimensionality, teams can easily collaborate, share reports, and access the information they need with ease.
#6: Create scalable reporting and analytics that will grow with your company
OneStream and Power BI create a unified data platform with the flexibility to add new data sources and dashboards as business requirements evolve and the company expands. With growth comes an increase in the volume of data to analyze. By automating reporting processes with accurate, real-time information, you eliminate strain on your team while maintaining data integrity.
How Can My Team Implement the OneStream and Power BI Integration?
Organizations can implement this integration in four simple steps through OneStream’s REST API. While figuring out this integration yourself is possible, working with an outside partner will save you hours of time and eliminate the burden of extensive R&D. Our team has developed a methodology to quickly, efficiently, and directly connect OneStream and Power BI while preserving core features such as dimensionality and hierarchies.
By integrating OneStream and Power BI, you can leverage the power of real-time data and streamlined reporting to make more informed business decisions faster. This seamless, scalable system will reduce data silos, foster collaboration, and boost productivity, making it a valuable investment for long-term growth. Set your company up for a successful future with the combined power of corporate performance management and business intelligence solutions.
About OneStream and Power BI
OneStream is a unified CPM (Corporate Performance Management) platform that offers financial consolidation, planning, reporting, and analysis in a single solution. It enables organizations to streamline their financial operations, reduce risk, and improve the accuracy and consistency of financial data. Learn more about our OneStream implementation services.
Power BI (PBI) is a business analytics service that provides interactive data visualizations and business intelligence capabilities with an interface that allows users to create and share reports and dashboards. These are two great platforms when used separately—but together, they can simplify reporting processes while providing financial leaders with more powerful data insights.