Data Analytics & Power BI Case Study
Client Summary
A leading commercial HVAC systems, services, and building energy solutions provider in the DC metro area.
- Industry: Commercial and Residential Energy and HVAC Services and Parts Distributor
- Location: 3 Offices in the Mid-Atlantic
Project Overview
- Customer Consultation Report — Built with Power BI
- Sales & Margin Analysis by Associate, Location, Part and Customer
The Client’s Goals
The General Manager of the organization’s parts distribution business was spending an inordinate amount of time compiling, manipulating and calculating data from multiple sources to produce key reports to analyze sales performance. Reports required detailed information by sales associate, customer and individual part number, as well as the ability to view weekly sales trends compared to budget and prior year.
Engagement Details
Opportunity Statement / Engagement Goals
We were engaged to enable the use of Power BI throughout the organization to bring efficiencies to reporting processes, enhance customer communication experiences, and make better decisions off the plethora of data available to them across their business segments.
Project Timeline
- Project 1 – Energy Engineer and Marketing Team – Customer Consultation Report (3 Weeks)
- Project 2 – Parts Distribution Group
- Phase 1 (4 Weeks) – Sales/Margin and Customer Analysis
- Phase 2 (3 Weeks) – Salesperson Incentive Automation and Reporting
Why Power BI?

Easy Activation with Office 365
Simpler Path to Business User Adoption
Quickest Route From Excel to Business Intelligence (BI) Reporting Platform
Robust Capability for Minimal Investment
Who Uses The Reports?
Energy Engineers
Marketing Team
Parts Division General Manager
Our 2-Phased Project Approach
Project 1 – Energy Engineer And Marketing Team – Customer Consultation Report (3 Weeks)
- Worked with team that communicates quarterly with customers to review quarterly impact report that outlines energy usage and outlines suggested maintenance plans, etc. to keep the building running efficiently
- Worked with the client to create centralized data source in Excel and library for customer images
- Developed a standardized template in Power BI that pulls in elements from centralized data sources
- Engineers now all working from one template
- Power BI automatically refreshes based on the templates
- Power BI generates PDF report across 50+ customers
Project 2 –Parts Distribution Group
- Phase One (4 Weeks) – Sales/Margin and Customer Analysis
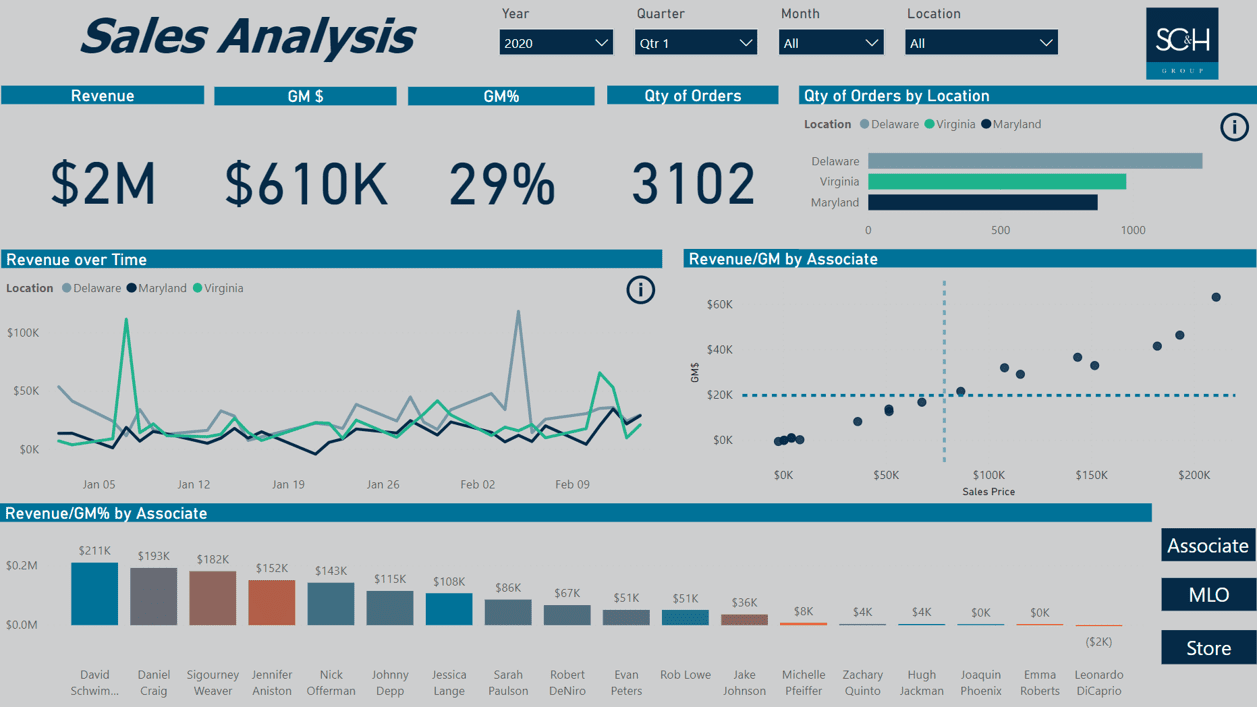
- Created a Weekly Invoice Sales tracking dashboard that is used every week in Executive team
- This was a pain point for the GM to create each week and took a few hours to do — now it is completely automated with far greater analysis capabilities (top 10 customers, sales people, tracking to budget)
- Phase Two (3 Weeks) – Salesperson Incentive Automation and Reporting
- Expanded upon the phase one project to enable Power BI to dynamically calculate sales incentives/commissions for sales associates
- Created relationships across a number of data sources to enable these calculations to occur automatically
- Enabled the ability to move this to a monthly vs a quarterly process
- Model is fully securitized and now allows salespersons to see their incentive targets and how close they are to goal in real time
- Power BI reports will be exported and sent to commission processing team
- Power BI tracks all sales quotas as well as major accounts by sales person
- Created standardized templates in Excel for the Parts GM to manage targets, and that is uploaded and stored in the client’s data warehouse
- Developed a new, trackable process for their sales person “non-financial” portion of their commission (e.g. store cleanliness)
We were engaged to enable the use of Power BI throughout the organization to bring efficiencies to reporting processes, enhance customer communication experiences, and make better decisions off the plethora of data available to them across their business segments.
Breaking Down the Results
- Both projects have reduced significant time from the report generation process.
- The client now has the ability to refresh any of the reports on-demand — previously this was only available on a 1x/month or 1x/quarter basis.
- Data is being directly sourced from the client’s ERP, CRM and other supporting systems via a Data Warehouse, so there is no further need for massive Excel files that must be manipulated to create reports–which are routinely error-prone.
- Enabled the Parts Group to now include or exclude “Services” revenue from their reporting, which they could not do prior.
- The ability to go from macro-level Sales/Margin analysis by location and store, all the way down to a particular part sale by day.
Sample Dashboard
This client’s live data has been modified for your enjoyment — looks like Jack never made it out of the Atlantic.


