With questions like, “How is my employee attrition affecting my bottom line?” or “How do I know my sales calls are worth it?” hanging over many executives’ heads without a solid answer, companies are turning to advanced reporting and analytics as a solution. To help address these challenges, executives are looking at data models as the foundation, bolstering a need for BI & analytics within their organization.
At the foundation of every BI & Analytics team, building business-driven data models are at their core. It is imperative to understand and translate domains of business into both logical (entity names & relationships) and physical (column data types, cardinality & key) constructs. These models help create key database frameworks for business and technical team collaboration, which in turn help build effective reporting & meaningful analytical insights to drive better decision making.
While the above sounds relatively straightforward, we often find that organizations struggle with the “first step” of creating a plan to build the appropriate data models for their domains of business. Through our experience, we have found that the below tips help get the planning process started, and in turn lead to the enablement of a business-driven data model for effective reporting & analytics:
“Business Needs” Inventory
It is imperative to dedicate time upfront to document conversations with key business stakeholders and subject matter experts. We have outlined the topics we find most important to cover:
- What are their current and future business challenges they are trying to solve?
- Being able to get the business to agree on a comprehensive set of business problems they are trying to address is crucial before any other steps in the process can occur.
- In addition to business challenges, you should document relevant reporting and business rules available within the organization to quantify topics of interest, drawing themes and measures to add to your data model. This is especially beneficial by having the executives’ business questions defined first.
- What is the best method to document these activities?
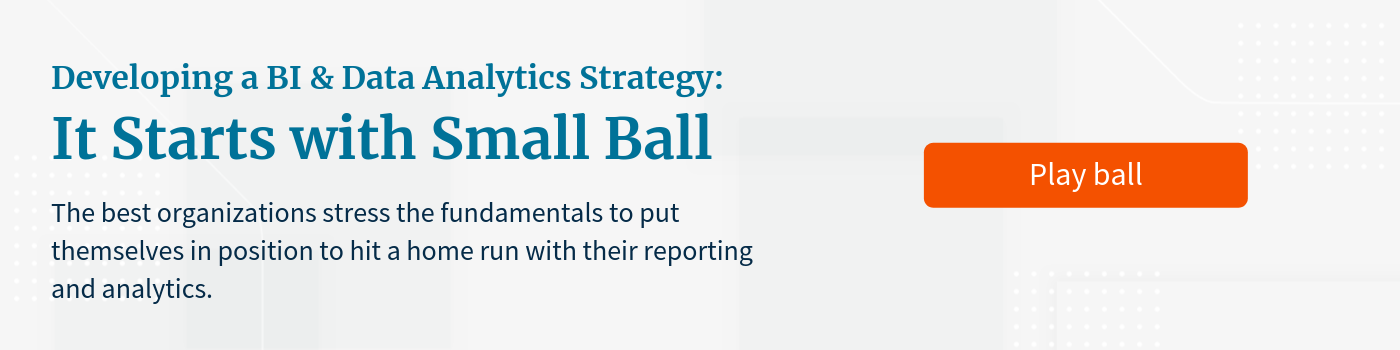
- We recommend building a business matrix to classify stakeholders, business problems, & reports into general topics of interest. You can continue to modify these themes as you move forward with your analysis:
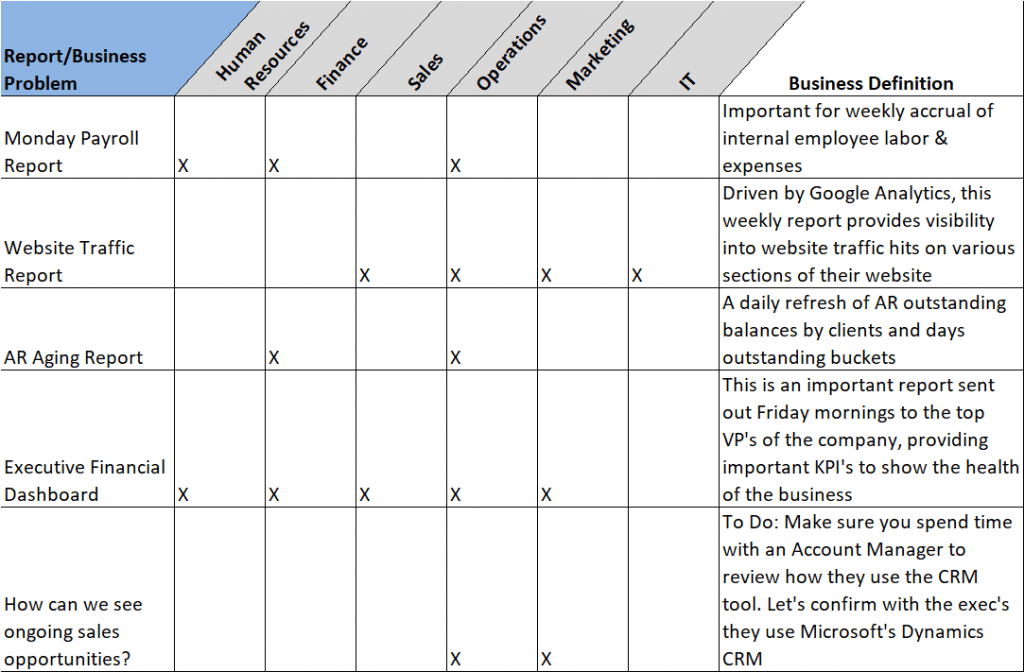
Image 1: This image shows a document, called ‘Business Needs Matrix’; notice on the matrix each report is detailed on the left; general business domains are at the top, and then ‘X’’s associate domains to reports. The business definitions on the right help to provide high-level descriptions of the reports, topics worth noting, and challenges currently facing the organization.
Establishing Business Domains
When we say ‘Business Domains’, it is the process of classifying main themes of your organization’s day to day operations and business functions. For example, SC&H is a consulting firm relying heavily on sales, human resources, marketing, and finance to target & deliver quality solutions to our customers. We like to think of domains as being the ‘overarching themes’ in your business:
With SC&H as an example, we could create some of the following domains in our data model:
- Human Resources: We need people to drive our organization; from consultants to internal employees, having the visibility to monitor & track talent is crucial for organizational success.
- Sales & Opportunities: Without our sales & delivery teams, SC&H would not be in business. Grouping all sales opportunities, current delivery, and completed work helps SC&H understand how we can continue to deliver excellence to our customers.
- Marketing: Visibility into key marketing trends and customer market presence is vital to ensure SC&H is pinpointing the right clients. From website traffic hits to social media campaigns, marketing data is extremely beneficial in data models.
- Financials: Even an accounting firm needs visibility into the financial metrics of business. This is an important domain with many metrics to consider in our model.
When you begin to classify your organization’s day-to-day business operations into distinct themes, it helps clarify how you should quantify data elements in your organization’s data model.
Entity Classification
Now that you have an understanding of business domains and existing reporting needs in the organization, it is important to think about the entities making up that domain. That is, the ‘who’ and ‘what’ of the domains inside your business driving its success. Additionally, identifying the characteristics (also referred to as attributes) is vital when qualifying aspects of your business. Bringing SC&H back as an example, let us look at the entities & characteristics that make up one of our most important domains, Human Resources:
- People: Without people both inside & outside of our organization, we would be not be successful as a firm. Tracking attributes like gender, age, birthdays, & nationality are all applicable in this entity.
- Employment: Having the ability to view employment details including employment start date, promotion date, office location, & job titles are critical when assessing talent internally.
- Location: This entity can be applicable across multiple domains. Understanding the location of our employees & clients is crucial; such attributes assigned to this entity could include address details, latitude & longitude of location, and building names.
Keep in mind that the entities assigned to your domains of business are specific to your business; only track information you feel will be necessary to maintain and support your overall business success when solving business problems.
Defining Relationships
After we have mapped our business challenges/reports, established a solid collection of domains, and brainstormed entities with applicable attributes, our next step is to understand how these entities are related. Relationships (also referred to as cardinality) between entities can be distinctly defined or loosely coupled which translate into primary/foreign key relationships when building out business-driven data models.
Referring back to our SC&H model, let us look at the relationships within our Human Resources domain to better understand this concept:
Image 2: Example of a high level-brainstorming document that maps the relationships between entities. Notice that you can have many relationships between the entities as they relate to one another in different ways.
The above diagram is a great way to brainstorm relationships between entities in your data model; sometimes entity relationships can occur between one or many attributes within the entity. Thus, it is imperative that you solidify the cardinality between each entity to build out an effective data model.
Prototype Design
Now that you understand the entities and their relationships, you are ready to start building your logical and physical conceptual layer, which begins the journey to create a business-driven data model. Many tools are available to support building data models, but having any application that supports a unified modeling language is preferable (applications include Oracle’s Data Modeler, Microsoft Visio, Star UML, etc.)
Let us see an example of how SC&H might build a conceptual data model using the Human Resources entities we described earlier. A common way of documenting relationships is the use of an entity relationship diagram (ERD), using crow’s foot notation to define entities and relationships in your model:
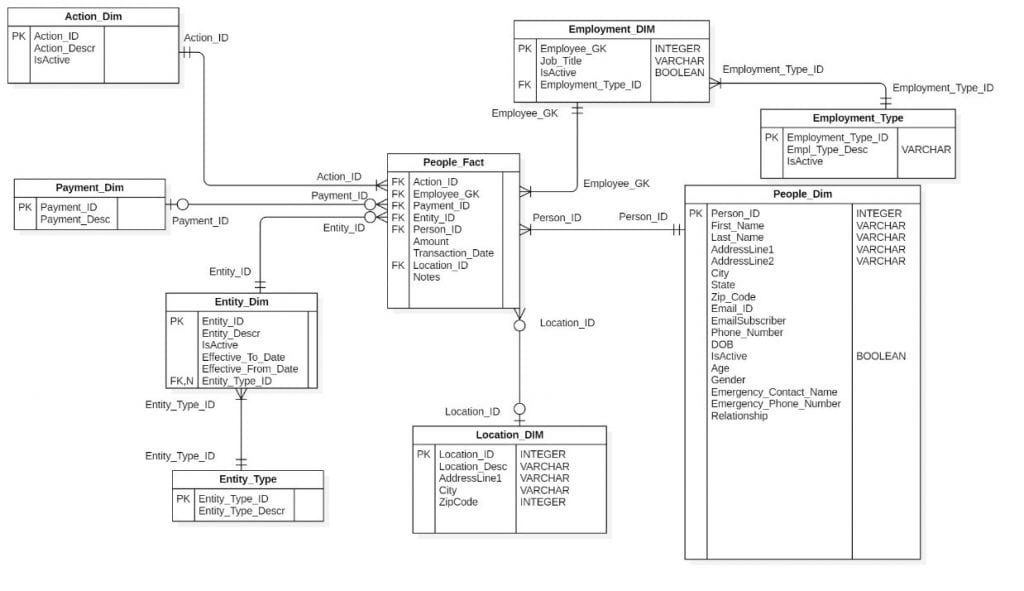
Image 3: Sample Entity Relationship Diagram that shows high level relationships between tables to support a typical snowflake schema, OLAP framework; note that this diagram uses Crow’s Foot Notation, highlighting the cardinality between the dimensions that tie to a table containing the measures the business may want to report (the measure table is also referred to as a fact table).
The above ERD diagram shows both cardinality and characteristics assigned to each entity. This style of documentation is not only helpful, but also absolutely required when collaborating with business and IT teams to build a solid data model.
As the famous statistician George E. P. Box once said, “All models are wrong, but some are useful.” This certainly applies when creating a business-driven data model: Keep in mind that building a business-driven data model is reiterative in nature and requires a lot of dialogue with business executives and subject matter experts to get it right. Further, you might need to revisit your original model and, if built correctly, these requests should be welcomed with open arms! From there, it is critical to continue to define domains that drive your business functions, identify key entities, and their respective characteristics. Upon defining the relationships between entities and understanding what the business wants to measure, you are now well on your way to building a solid data model, supporting reporting & analytics beneficial to both business and IT.
Curious to learn more about how business-driven data models can bolster your organization? Please reach out to us today.