Authored by Andrew Thompson | Managing Director, SC&H Financial Advisors, Inc.
If you haven’t recently been in the market for a used car or even filled yours up with gas, I hate to break the news that it’s going to cost you about 25% more than it did only a year ago. Inflation is back, and it hasn’t been this bad since 1982. Too much currency chasing too few goods is exactly what has led us to the inflation and devaluation we’re seeing today. Beyond putting a strain on your wallet, there are other implications to consider. Here’s the most pressing question we’re being asked right now:
“What changes should I make to my investment portfolio?”
Before we discuss your investments, let’s first discuss the aforementioned implications, starting with purchasing power. Purchasing power is your current wealth’s ability to maintain its value over time by keeping up with the rise in inflation. If inflation rises by 3%, you’ll want to be sure your wealth has increased by 3%. Owning investments that simply maintain their value at inflation will not provide for any real increase in your wealth over time.
This is of particular importance for retirees who are drawing on a portion of their investment portfolio each year. If inflation is at 3% and your investments are rising at 3%, you’ll break even. However, if you’re drawing out 4% annually from your portfolio, your portfolio will decline in both nominal and real terms each year. Fortunately, there is an antidote to this dilemma: own investments that have demonstrated an ability to outpace inflation, thus maintaining their purchasing power net of withdrawals.
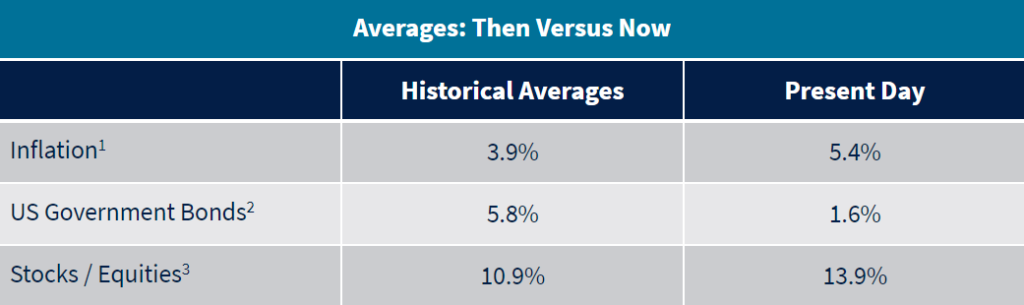
If we assume these averages continue, one will lose their purchasing power consistently by owning only cash and bonds. That loss is magnified in above-average inflationary periods such as now.
Let’s explore a few real-world examples:
Interest Rates
If the interest rate on your checking and savings account is 0%, you’ve realized a negative 5.4% rate of return over the last twelve months in real terms. While your balance has remained the same, your dollars will buy less than 95% of what they could buy this time last year.
Fixed Annuity
If your fixed annuity is earning 3% per year, well, you just saw 2.4% of it vanish over the past year. And if you’re receiving a fixed pension, it too has lost about 5.4% of its value over the past year. Furthermore, if your wages increased by less than 5.4%, you’re making less money this year in real terms than you were last year.
Social Security
For those receiving Social Security income, you may have been notified that your income was set to increase by 5.9% next year. Unfortunately, that means you’re merely only keeping up with the rise in prices, not getting much of a raise. You’re maintaining your purchasing power, well, you’ll be close to it anyway but you’re not making more than last year.
Now, let’s discuss your investment portfolio.
When it comes to wealth management, we’re firm believers that all successful investing is goal-focused and planning-driven while all failed investing is market-focused and event-driven. When it comes to your investment portfolio, this means:
- You have a goal-focused financial plan based solely on your unique set of circumstances
- Your portfolio is constructed only after that plan has been fully thought through and developed
- As a long-term investor, your portfolio will have significant ownership of equities
All things considered, the ownership of equities as part of your overall financial picture is the best-known line of defense against inflation when we consider all the evidence—notably the historical rates of return (about 10% per year). This exposure is what can provide the critical component of purchasing power and wealth accumulation over time. Otherwise, we’re far more likely to suffer the impact of inflation which, as we discussed, erodes your wealth’s ability to maintain its value in real terms.
Offsetting Inflation to Maintain the Value of Your Wealth
Inflation isn’t the signal to sell equities, far from it. It’s the very reason we own them. Over the long term, a diversified allocation of the largest companies in the world has shown to be an effective hedge against inflation. We’ve witnessed returns of cash and bonds, both either at or well below inflation rates. If that’s the core component of a portfolio, you have little chance of sustaining your ability to keep up with the rising cost of such things as food, energy, and healthcare.
Now, that’s not to say that cash and bonds don’t have a place in your portfolio. They play a crucial role, providing necessary liquidity in the short term. For example, when equities have temporarily dropped by more than their annual historical average (14.3%)4 one may consider using excess cash versus selling equities for the income they need. When you have a known need for money in 2-5 years, bonds may be an optimal place to park that money. Getting that mix right is the critical component for long term investment success.
I have no foresight into what the future holds for inflation, or any other market event. What I do know, and what our team understands best, is that with proper planning and perspective, we have incredible antidotes to an unknown and uncertain future. If you’re feeling anxious or have questions about how all of this impacts you and your portfolio, please reach out to our Wealth Management team.
1 Historical inflation is the average over the last 50 years as measured by Headline CPI, a measure of the total inflation within an economy, including commodities such as food and energy prices. Source: J.P. Morgan Asset Management; “Guide to the Markets.” Oct. 31, 2021 (“J.P. Morgan: Guide to the Markets”).
2 US Government bond returns are measured by the nominal 10-year treasury yield between 1958 and 2021. Source: J.P. Morgan: Guide to the Markets.
3 Stock / equity returns are measured by the S&P 500 Index. Historical average is the last 50 years through 2020. Present day average is the last 10 years through 2020. Source: The Motley Fool; “Average Stock Market Return.” Updated Sept. 3, 2021.
4 This figure refers to intra-year drops, which is measured as the largest drop from a peak to a trough within a year between the years 1980 through 2020. Source: J.P. Morgan: Guide to the Markets.