Data Strategy & Analytics
Turn your Data Into Business Intelligence
Imagine what your business could accomplish with data that is not only at your fingertips but comprehensively synced with your business goals. Our engagements start with a 360-degree view of your organization’s objectives, resources, readiness, and technologies. From there, we partner with your team to design a modern data solution that meets your requirements now and in the future. No matter the simplicity or complexity of your project, we can give your data meaning:
Data Strategy
Advance your data, technology, and KPIs to inform actionable decisions.
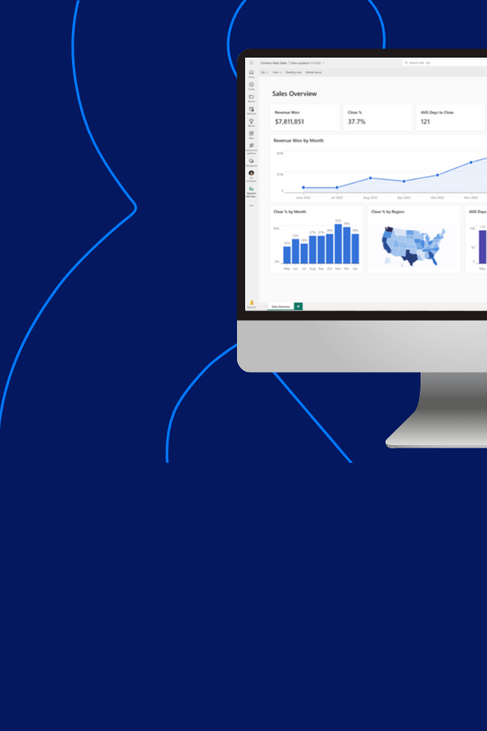
Data Visualization
Leverage intuitive data dashboards and accurate reports to gain critical insights.
Enterprise Data Warehousing
Integrate data from disparate sources to analyze business performance.
Data Management and Integration
Automate data and data pipeline capabilities across core business applications and workflows.
Data Science
Utilize predictive modeling, machine learning, and AI to discover patterns in volumes of data.
KPI Development and Benchmarking
Develop standardized metrics that can be analyzed over time and compared against industry standards.
Technology and Platform Selection
Ensure right-fit solutions are identified and implemented to enhance scalable analytic capabilities.
Outsourced Analytics
Gain total data management, analytics, and reporting without hiring a full-time, in-house resource.
Turn Data into Actionable Intelligence
Transform your data into a powerhouse of real-time information and intelligence with the help of SC&H. Like you, we recognize that data projects on any scale can be tough to start, overwhelming, or fall short of your vision—we go above and beyond to break that mold. With the right blend of strategy, technology, and process, we streamline your data spanning all critical business units into one centralized location.

Learn how streamlined data and improved analytics can change the game for your business.
Invest in the Right Technology for Your Business


Data Results that Exceed Expectations
By streamlining and automating your data processes, our team can ensure you have complete access to reliable, accurate figures that offer data transparency, tell a unified story, and enable better business decisions. We plan, execute, and deliver with precision to exceed your expectations every step of the way.