It is no secret that a well-designed user experience on web and mobile platforms is tremendously impactful to overall consumer engagement and perception of your organization/product. In the modern age of digital consumption, websites that dynamically present information cleanly, interactively and most pertinent to the individual consumer are becoming a necessity rather than a luxury. The days of static web and mobile content are coming to an end.
A trending method to meet this demand is the inclusion of interactive graphics and dashboards into an organization’s website and/or professional portal. Products like Microsoft Power BI Embedded are making this a reality for companies both large and small. Embedding analytics into your organization’s site or applications may sound daunting, but it is a quick and low-cost way to create business value and boost customer engagement. Stick with us as we walk through a recent implementation and cover the capabilities it brought to our client and their customer base.
The Business Challenge
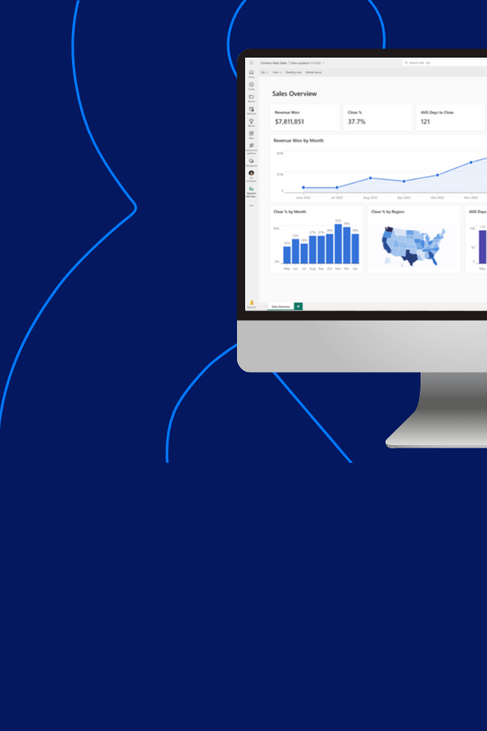
One of our clients utilize a Drupal platform for their external website and as a professional portal that enables critical information for the different entities they partner with. In particular, the professional portal was missing the mark and not gaining the traction or usage our client had expected. The portal was clunky, attempted to provide a large amount of data in overwhelming tables and text, lacked filtering capabilities and didn’t take advantage of data visualizations to help users quickly spot outliers or trends.
In short, we needed to provide our client with an open and accessible analytics platform in their existing Drupal website and replace their outdated display with a modern data experience for their users. This included the ability to filter datasets down, compare a single entity to a larger population for benchmarking, and to compare segments of data against each other. One other major requirement was security – we needed to pass User Ids from Drupal into Power BI to restrict access to data based on row-level security set up within the report.
The Solution
Power BI Embedded provides all the capabilities of Power BI without requiring users to have Power BI licenses. Additionally, we were able to pass User Ids and User Roles from Drupal to the Power BI report and take advantage of row-level security. Embedding Power BI can be tricky the first time it’s attempted. There are several types of embedding outlined in documentation, so it helps to know exactly which type of embedding you need.
Microsoft offers Embedding for your Organization and Embedding for your Customers. If your users have Power BI licenses and are part of your organization, Embedding for your Organization is sufficient. We needed to use Embedding for your Customers. Additionally, we also needed to decide if we would keep a Power BI user account tied to the configuration, or instead use a Client Id and Client Secret to authenticate a connection. As we didn’t want to attach a user account to the configuration, we opted to use a Service Principal Account when setting up the Azure Active Directory Application.
Configuring Power BI and Azure AD for Embedding
Part one of this saga begins with the basics – we created a Power BI report and published it to an upgraded Workspace (this is important later on for configuring that the Service Principal has access to the Workspace). Next, we created an Azure Active Directory Application and specified which Power BI APIs it would have access to. Since we needed the Service Principal to have access to the Power BI content and APIs, the Power BI admin enabled allowing Service Principals to use Power BI APIs in the Tenant Settings section of the admin portal. Lastly, we gave our Azure Active Directory Application access to reports, datasets and dashboards by adding the Service Principal as a user or admin to the workspace. Click here for further detailed information.
Python Flask App to Retrieve Power BI Report
At this point, we were ready to configure our Python Flask application. At a high level, this application requests a token from the Azure AD Application, then passes this token along to the Power BI Service which then uses it to authenticate. We also need to pass in Ids to identify the Power BI Workspace, report, report page and tenant.
Row-Level Security
Power BI Embedded also supports using Roles and Row-Level Security. The client needed to limit the data shown based on a user’s assigned access and role. To accomplish this, we can pass the user’s unique UUID and role via query string parameters in the iframe URL that calls the Flask app. This URL is not explicitly visible to users and since UUID is a random string of numbers and letters, it is not easily compromised. Once in the Flask app, this UUID is passed to the Power BI Service as part of the GET request and the appropriately filtered report is returned.
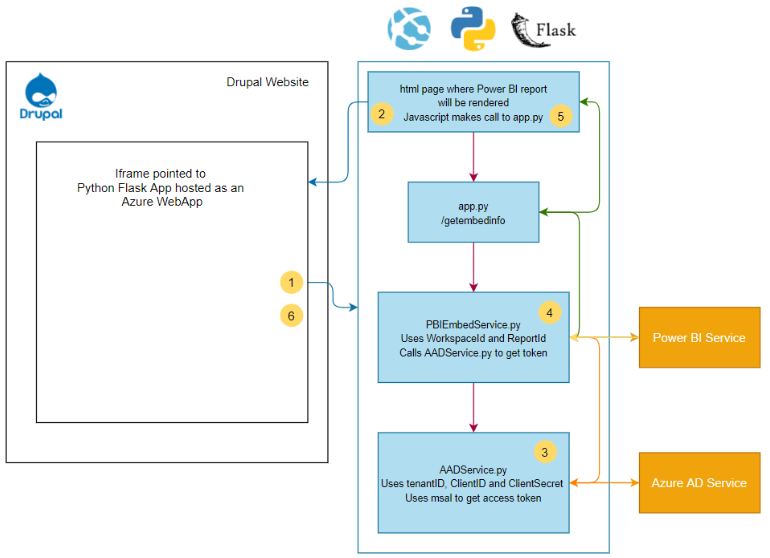
Logical Flow from Within Drupal Website to Returning Power BI Embedded Report
- An iframe tag within the Drupal website points to the Flask App which is hosted as an Azure Web App.
- JavaScript makes an Ajax Get-request to app.py, the main driver of a Flask application, and passes in the User Id and Role directly from Drupal to the Flask app. In turn, app.py calls PBIEmbedService which calls AADService.
- AADService sends a Get-request to the Azure AD API which returns an authentication token for the Power BI Service.
- PBIEmbedService sends this token along with the Workspace Id, Report Id, User Id, Role and Report Page Id to get the report.
- The report is returned to the original JavaScript Ajax call. Additional JavaScript uses the Power BI Client API to control how the report is displayed. In our case, we opted to hide page navigation and the filter pane. This section can also be used to set filters, apply bookmarks or edit context menus.
- Lastly, the report is rendered back in the original iframe of the Drupal website.
Wrapping Things Up
Hopefully this deep-dive into Power BI Embedded brings clarity to how it can be used to enhance a website or mobile application and helps outline some of the initial steps to get it up and running. With the success we have seen thus far, we expect the embedding of analytics and use of server-less products like this to become the norm to bring information to life and increase consumer engagement.
[sch_cta_box title=”Does Your Organization Leverage OneStream?” button_label=”Schedule a 1:1 Demo” button_url=”https://marketing.schgroup.com/onestream-power-bi-demo” bg_image=”/wp-content/uploads/2019/05/Primary-Vertical-e1614887994454.jpg”]If so, learn how to maximize your investment with a OneStream and Power BI integration.[/sch_cta_box]